Bollinger Band or B- Band is a technical indicator that you easily use in Binomo. This indicator is the combination of standard deviation and moving averages that measure the market volatility and helps us to check the trend.
About Bollinger Band
Bollinger Band is an indicator that you can use to identify the current trend. This indicator was developed by John Bollinger in 1980 after years of research and experiment to help the traders to identify the high probability trades using overbought and oversold zones.
This Indicator is made from three important lines upper line, middle line and lower line. Where the upper and the lower line is the standard deviation and the middle line is the SMA. You can also use them as support and resistance when the price is fluctuating between the middle and other bands.
Tutorial on the setup of Bollinger Band on Binomo
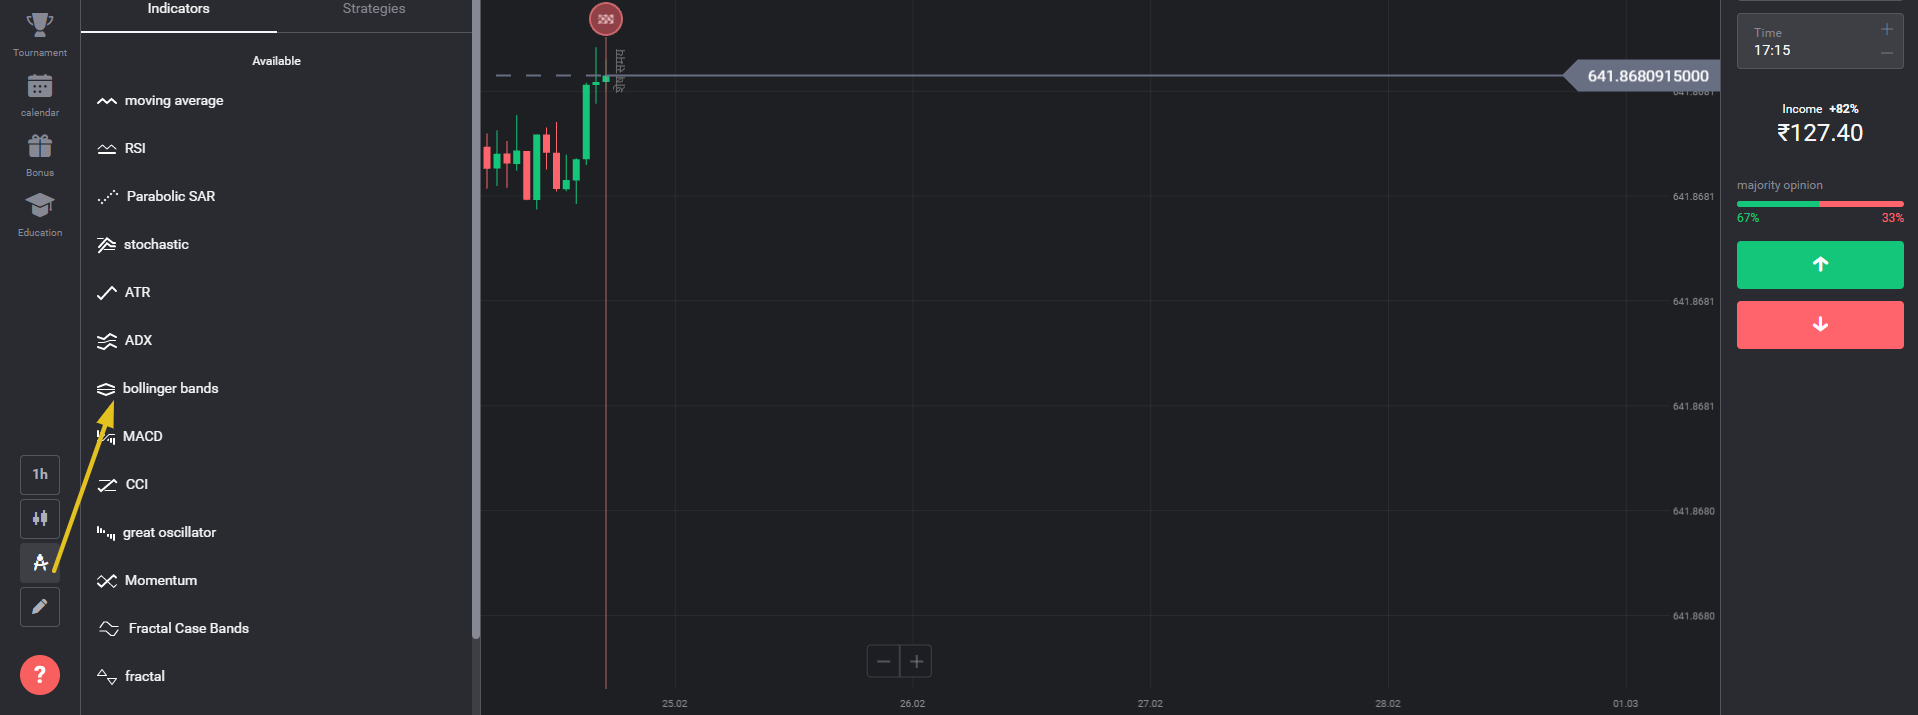
Firstly, log in to your Binomo account. Once you have logged in you need to click on the indicator button and search for the Bollinger Band indicator.

You can change the indicator colour and time for better visibility. The default setting for the indicator is 20, 2. which works perfectly. so don’t need to change that.
How to use Bollinger bands at Binomo?
B- Band is a great indicator and you can easily identify the market volatility using the same. As I said above, This indicator is made from the combination of standard deviation and moving average. Where the upper line and the lower line is standard deviation and the middle line is SMA.
When the B- Band expands which means when there huge gap between the price and the indicator it signals that the market is highly volatile. Similarly, When there is a very little gap between price and the indicator it signals that market is low volatility and trend is unlikely to happen.
Place buy trade using Upper line

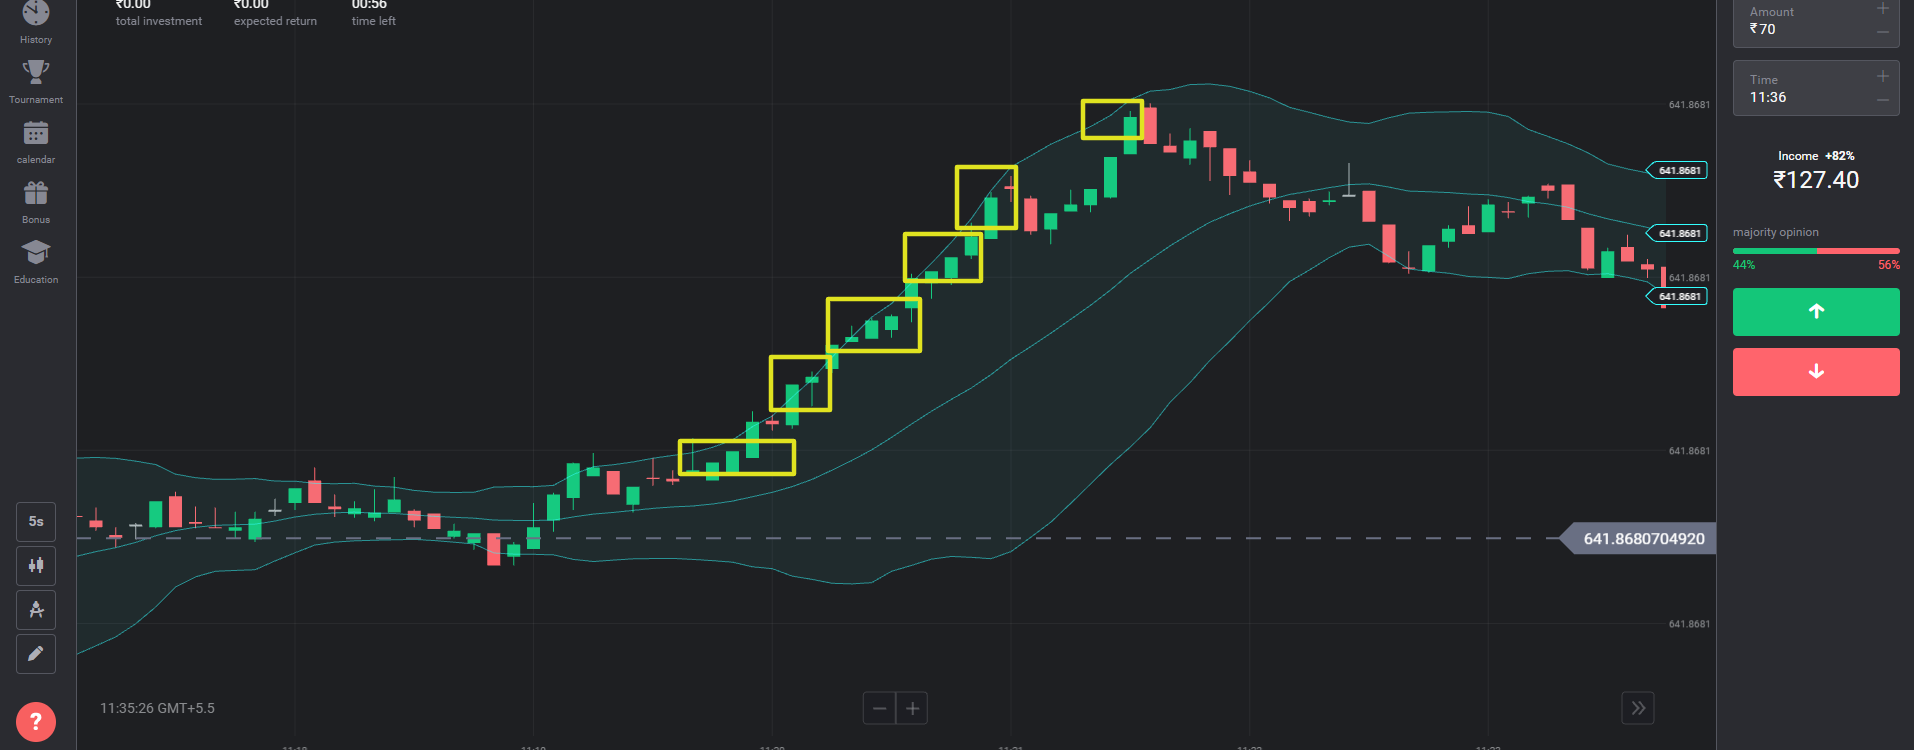
When the hits the upper band of the indicator and is constantly moving in an uptrend it signals a bullish and here we can open a buy trade.
Place Sell trade using the lower line

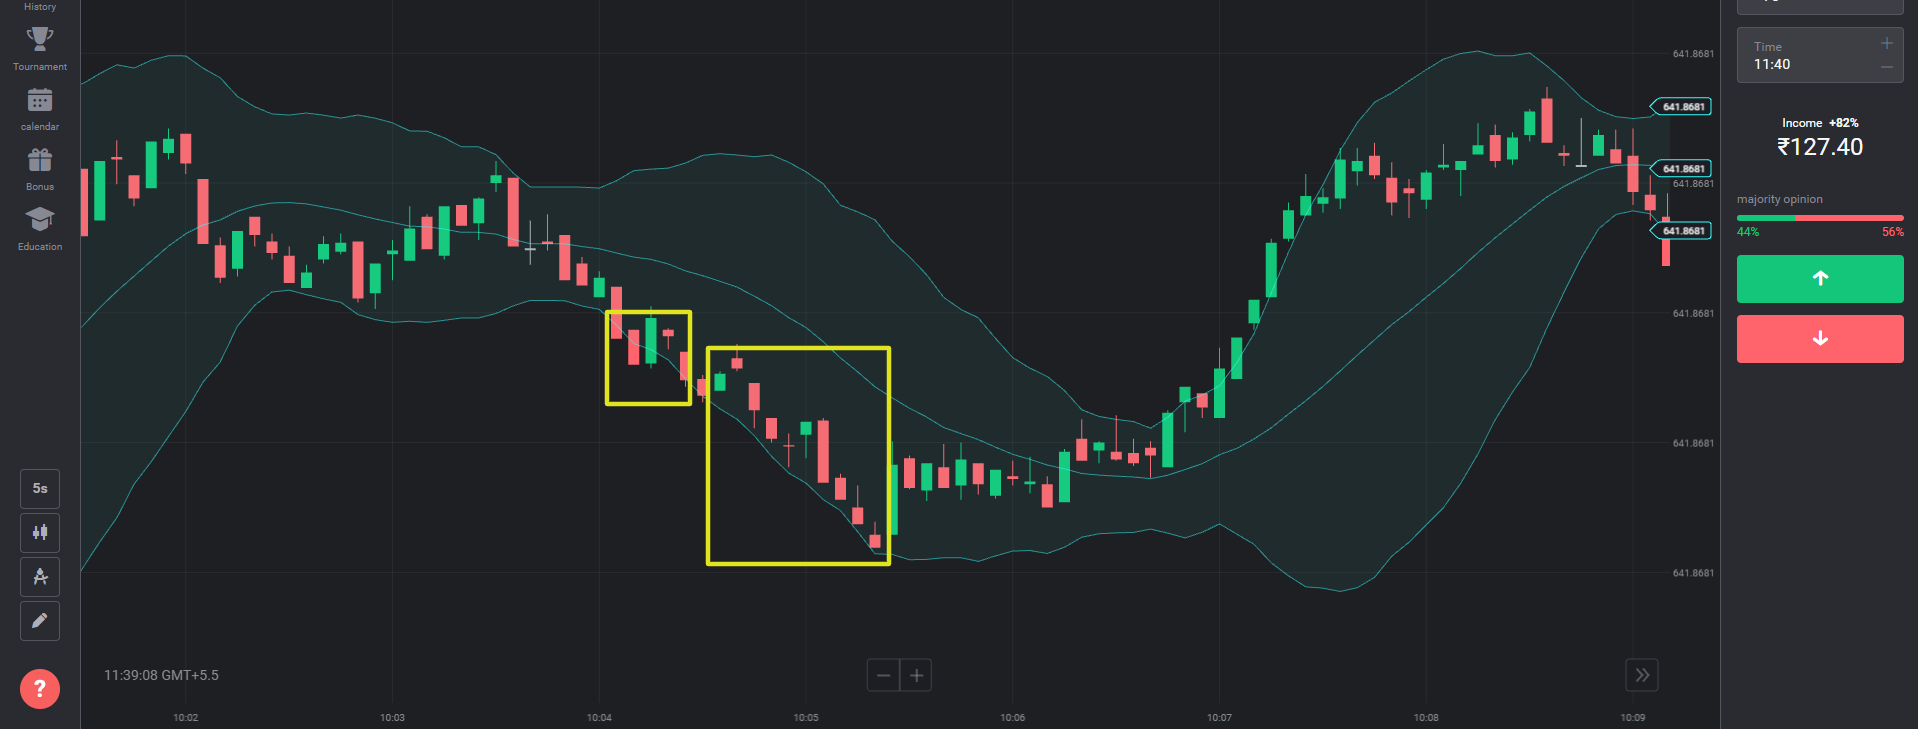
When the price hits the lower band and is constantly in the downtrend it signals a bearish trend and we can place a sell trade here.
The best way to understand the B-B band is by practising and analysing the indicator on the Binomo practice account. You will get $10, 000 free virtual chips which are more than enough. Comment below your experience If you find the indicator helpful.
